1. Introduction
Modern Portfolio Theory (MPT) is a framework for constructing portfolios that aim to maximize expected returns while minimizing risk. It was introduced by Harry Markowitz in 1952. The theory is based on the idea that investors should not focus solely on individual securities but rather on the overall portfolio of investments. MPT provides a way to measure portfolio risk and return and provides tools to optimize investments.
1.1 Importance of Modern Portfolio Theory
The significance of Modern Portfolio Theory lies in its ability to provide a rational approach to investment decisions. MPT allows investors to make informed decisions by analyzing the risks and returns of various investment options. By diversifying investments across a range of assets, investors can reduce the overall risk of their portfolio without sacrificing returns. In addition, MPT provides a framework for constructing optimized portfolios to meet specific investment goals. Using MPT, investors can construct portfolios tailored to their needs and risk tolerance.
Both individual and institutional investors have widely adopted MPT. As a result, it has become a standard tool for asset managers and financial planners to construct and manage portfolios. In addition, the development of computational tools and software has made it easier for investors to apply MPT in practice. Today, investors can access a variety of online platforms and libraries, such as Python’s Pandas and NumPy, to implement MPT. Additionally, the availability of financial data through services such as Yahoo Finance and Google Finance has made it easier for investors to access the data needed to construct an optimized portfolio.
2. Portfolio Optimization
Portfolio optimization is constructing an investment portfolio that maximizes returns while minimizing risk. Modern Portfolio Theory (MPT) provides a framework for portfolio optimization using mathematical models to analyze the relationship between risk and return. Portfolio optimization involves a series of steps that help investors create a diversified portfolio that is optimized for their investment goals and risk tolerance.
2.1 Steps to generate optimal allocation using Modern Portfolio Theory
The first step in portfolio optimization using MPT is to identify a set of investment options. These investment options can be individual securities or asset classes. The next step is to collect data on the historical performance of these investments, including their returns and risks. Once this data is collected, the investor can use MPT to generate an optimal allocation of assets.
The optimal allocation is calculated using the efficient frontier, a graph representing the relationship between risk and returns for a given set of investments. The efficient frontier identifies the optimal portfolio of assets that provides the highest expected return for a given level of risk. The optimal portfolio is then calculated by determining the weights of each asset that make up the portfolio.
2.2 Definition of functions for portfolio performance calculation and generating random portfolios
Several functions are used in portfolio optimization to calculate portfolio performance and generate random portfolios.
Mean Return: The first function is the mean return, which is the average return of an investment over a specific period.
Variance: The measure of the volatility of an investment’s return.
Covariance: The measure of the degree to which two investments move together.
Random portfolio: A portfolio is constructed by randomly selecting weights for each asset.
Random portfolios are created to test the robustness of the optimal portfolio weights.
By generating multiple random portfolios, investors can determine the optimal portfolio weights' stability and assess the portfolio’s risk.
2.3 Calculation of optimal portfolio weights and Sharpe ratio
The optimal portfolio weights are calculated using a mathematical formula that considers each asset’s expected returns, risks, and correlations. Once the optimal portfolio weights are calculated, investors can assess the portfolio’s risk by calculating the Sharpe ratio.
Sharpe ratio: It is a measure of the risk-adjusted return of a portfolio. It is calculated by dividing the excess return of the portfolio (the return above the risk-free rate) by the standard deviation of the portfolio’s returns.
The higher the Sharpe ratio, the better the portfolio’s risk-adjusted performance. The Sharpe ratio is a valuable tool for investors to compare different portfolios' performance and assess their investments' risk.
3. Sample Calculations for Gold and Nifty 50
We have run the above simulation for Gold and Nifty 50 for the last ten years.
Here are the results :
	Optimal Weights:  [1.34691934e-04 9.99865308e-01]

	Optimal Return:  0.08907221573057132

	Optimal Standard Deviation:  0.1699443291654132

	Optimal Sharpe Ratio:  0.5241258485528751

	Optimal Weights:  [1.34691934e-04 9.99865308e-01]

	Optimal Return:  0.08907221573057132

	Optimal Standard Deviation:  0.1699443291654132

	Optimal Sharpe Ratio:  0.5241258485528751
Please do not take investment decision based on above result, consult your financial advisor.
4. Graphical Visualization of Results
Modern Portfolio Theory involves the use of complex mathematical calculations to generate optimal allocation for a portfolio. However, these results can be challenging to interpret without visual aids. Therefore, graphical visualization is an essential aspect of Modern Portfolio Theory as it provides investors with a clear understanding of the trade-off between risk and return. This section will discuss the different types of graphical representations used in Modern Portfolio Theory and how to interpret them.
4.1 Scatter Plot of Portfolio Returns vs. Standard Deviation
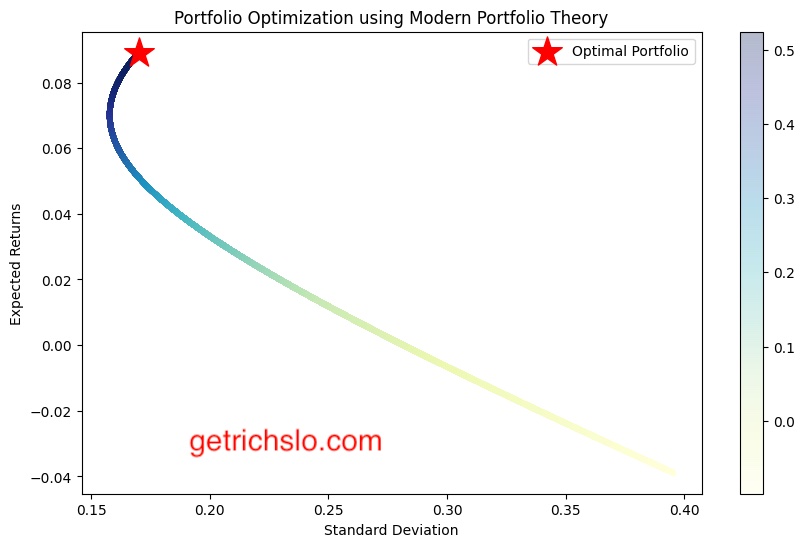
The scatter plot of portfolio returns vs. standard deviation is a widely used graphical tool in Modern Portfolio Theory. It visually represents the trade-off between risk and return for a portfolio. The x-axis represents the standard deviation or risk of the portfolio, while the y-axis represents the portfolio’s expected return. Each data point on the scatter plot represents a different allocation of assets. The scatter plot allows investors to identify the optimal portfolio allocation that provides the highest return for a given level of risk.
4.2 Efficient Frontier Graph
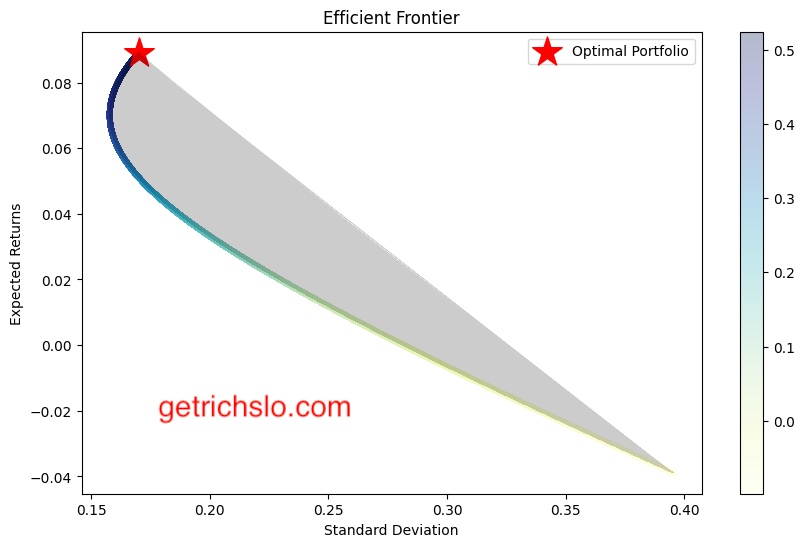
The efficient frontier graph is another commonly used graphical tool in Modern Portfolio Theory. It is a plot of the portfolios that provide the highest expected return for a given level of risk. The efficient frontier graph is derived from the portfolio returns vs. standard deviation scatter plot. It allows investors to visualize the trade-off between risk and return and identify the optimal portfolio that maximizes returns for a given level of risk. The portfolios on the efficient frontier are considered efficient, meaning they provide the highest return for a given level of risk.
4.3 Capital Market Line (CML) Graph
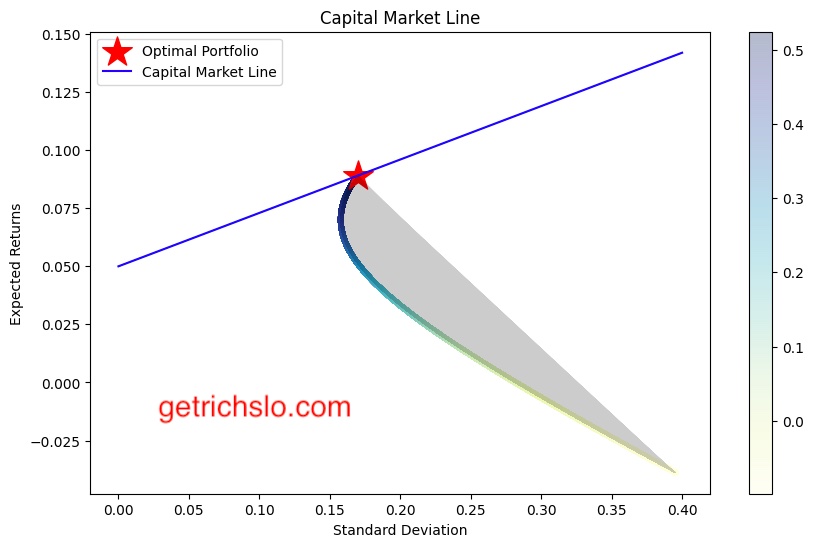
The Capital Market Line (CML) graph is a graphical representation of the risk-return trade-off for a portfolio that includes risk-free and risky assets. The CML is derived by drawing a line from the risk-free rate to the point of tangency with the efficient frontier. The slope of the CML represents the Sharpe ratio, which is a measure of the excess return per unit of risk. The CML graph allows investors to identify the optimal portfolio that provides the highest Sharpe ratio.
4.4 Correlation Matrix Graph to Show Portfolio Diversification
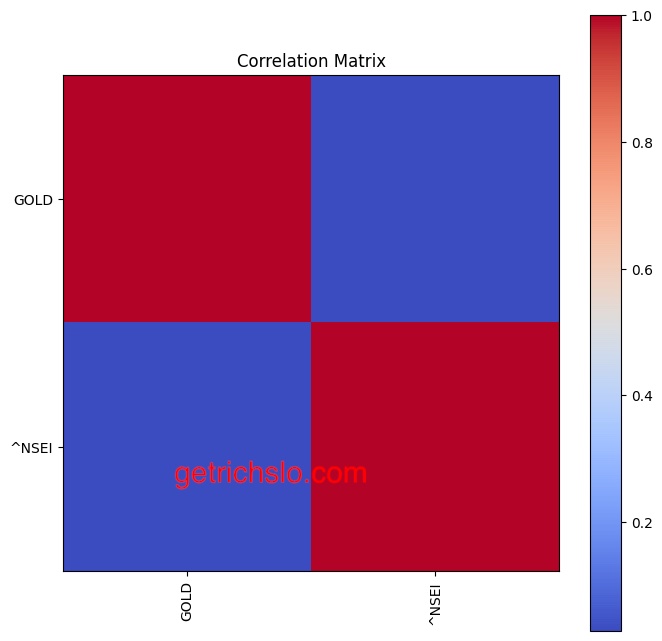
The correlation matrix graph is a graphical representation of the correlation between different assets in a portfolio. It helps investors to understand the diversification benefits of a portfolio. A correlation matrix graph shows the correlation between each pair of assets in the portfolio. A correlation of 1 indicates a perfect positive correlation, while a correlation of -1 indicates a perfect negative correlation. A correlation of 0 indicates no correlation. A well-diversified portfolio should have assets with low or negative correlation to reduce overall portfolio risk. The correlation matrix graph allows investors to identify which assets are positively or negatively correlated and adjust their portfolios accordingly.
5. Criticisms and Limitations of Modern Portfolio Theory
Modern Portfolio Theory is a widely-used investment strategy that has proven effective in optimizing investor portfolios. However, like any other investment strategy, it has limitations and criticisms. In this section, we will discuss the criticisms and limitations of Modern Portfolio Theory.
One of the primary criticisms of Modern Portfolio Theory is that it relies heavily on historical data to make assumptions about future returns and risks. This can be problematic because the markets constantly change, and past performance may not indicate future results. Additionally, Modern Portfolio Theory assumes that all investors have access to the same information and that they all have the same level of risk aversion, which is only sometimes the case.
Another limitation of Modern Portfolio Theory is that it assumes that asset returns are normally distributed, which is only sometimes the case. As a result, asset returns can be highly skewed, have fat tails, or exhibit other non-normal characteristics, significantly affecting portfolio optimization results.
Behavioral finance is another challenge to Modern Portfolio Theory. It suggests that investor behavior is irrational and influenced by emotions, biases, and heuristics. Modern Portfolio Theory assumes that investors are rational and decide based on expected returns and risks.
Despite its limitations, Modern Portfolio Theory remains a popular investment strategy that financial professionals and individual investors use. By understanding its assumptions and limitations, investors can make more informed decisions when constructing their portfolios.
6. Practical Applications of Modern Portfolio Theory
Modern Portfolio Theory has a wide range of practical applications in various areas of finance. For example, it has been extensively used in Asset Management Industry, Personal Finance, and Corporate Finance to manage and optimize portfolios.
Modern Portfolio Theory has been widely adopted in the Asset Management Industry to create portfolios that can deliver the best risk-adjusted returns to investors. Portfolio managers use Modern Portfolio Theory to construct diversified portfolios that maximize returns for a given level of risk. The theory’s application in asset management has become so widespread that it has become the cornerstone of the investment management industry.
In Personal Finance, Modern Portfolio Theory can be used to design investment portfolios that align with an individual’s financial goals, risk tolerance, and investment horizon. By constructing a portfolio that incorporates assets that are not perfectly correlated with one another, investors can diversify their risk and maximize their returns. In addition, modern Portfolio Theory’s implementation in personal finance has resulted in the development of robo-advisors, which are digital platforms that construct and manage investment portfolios using algorithms based on the theory.
In Corporate Finance, Modern Portfolio Theory is used to determine the optimal capital structure of a firm. By optimizing the mix of debt and equity, firms can maximize their market value and minimize their cost of capital. The theory also provides insights into how firms should allocate capital to their projects and investments to maximize shareholder value.
Overall, Modern Portfolio Theory’s applications in finance have revolutionized portfolio management and optimization. Using its principles, investors and financial professionals can construct better-diversified portfolios, deliver higher returns, and are less risky than traditional ones.
7. Conclusion
In conclusion, Modern Portfolio Theory (MPT) is a vital finance portfolio optimization tool. It is founded on diversification and optimizing portfolio risk and return trade-offs. MPT considers various assets' expected returns, risks, and correlations, enabling investors to make informed investment decisions. The graphical visualization techniques used in MPT, including scatter plots, Efficient Frontier graphs, Capital Market Line (CML) graphs, and Correlation Matrix graphs, help investors analyze the risks and returns of different portfolios. Despite its practical and theoretical limitations, MPT is widely used in asset management and personal and corporate finance.
MPT’s future implications for investors and financial professionals are also essential. As technology advances, investors and financial professionals must keep pace with these advancements to remain competitive. This requires an understanding of sophisticated analytical tools and techniques for portfolio optimization. Furthermore, the challenges posed by behavioral finance must be addressed in the future, as they can impact investment decision-making. Therefore, modern Portfolio Theory remains a critical tool for portfolio optimization, and its importance will likely increase.