The inside bar is a popular breakout system that offers quick results.The pattern formation occurs frequently in the market.
The pattern signifies the markets unwillingness to push price higher or lower, and hints to the temporary indecision in the market.
Getting a hang of the inside bar strategy can boost a trader’s profit.
In this article let us dig deep into the inside bar trading strategy.
What does an inside candle mean?
An inside candle is a price action trading strategy, where the high of the current candle is lower than the high of the previous candle, and the low of the current candle is higher than the low of the previous candle, i.e. the previous candle(also called mother candle) engulfs the current candle(also called child candle).
The relative position of the child candle can be at the top, the middle or the bottom of the mother candle.
There could be one or multiple inside bars, meaning multiple smaller candles engulfed within one large candle.
Formation of an inside bar indicates that the instrument is consolidating. It is consolidating because the bulls coud not create a higher high and the bears could not bring the market to a lower low.

The above picture helps us remember this pattern, where the mother duck is the larger candle, and the subsequent smaller candles are the children.
What is an inside bar candle?
Now that we have an idea of the candles. Let us look into the variants of inside bar.
-
Small Range : When the range of the child candle is smaller than the mother candle, it is called small range, and it represents indecision and low volatility in the market.
-
Big Range : When the range of the child candle is almost as big as the mother candle, it is big range. If the body is large it represents strength of the trend, however, if the body is small, it represents, indecision.
-
Multiple Inside Bars : When there are multiple children, engulfed by a mother candle, it signifies low volatility, and signals a big breakout, on the either side.
Historically, if the size of the inside bar compared to the mother bar is smaller, that forms a setup with higher profitability.
Ideally, small inside bar formation within the upper or lower half of the mother bar, is a perfect trade setup.
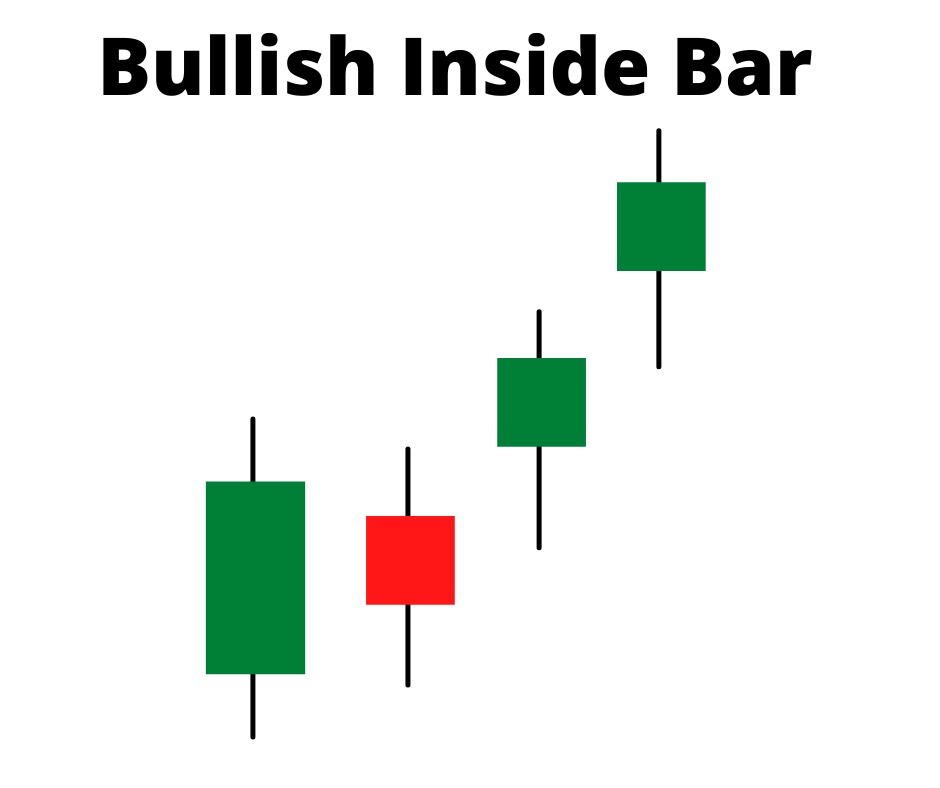
Bullish Inside Bar Candle
When an inside bar forms at the support, it signifies a potential uptrend, and is referred to as a bullish inside bar.
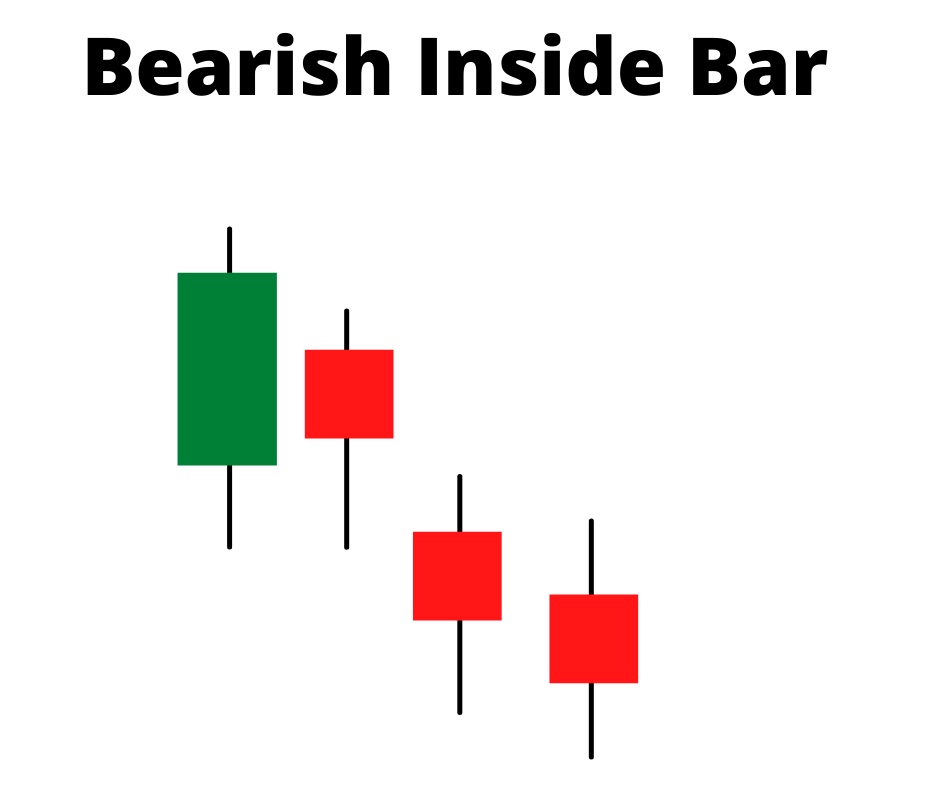
Bearish Inside Bar Candle
When an inside bar, forms at the resistance, it signifies a potential downtrend, and is referred to as a bearish inside bar.
Formation of an inside bar is only a probability, not a certainity at resistance, and it may or may not be guaranteed that the market will go down. Other inidicators need to be checked for confirmation.
Additionally, the colour of the child candle does not signify any trend direction. Even a bearish child candle can follow an uptrend and vice versa.
How to Trade Inside Bar Candle?
The Inside candle is a sign of market consolidation. So we can draw a horizontal support and resistance level, from the high and low of mother candle.
When the price breaks either the support or resistance line we expect that the price action will continue to move in the direction of the breakout.
Entry
When the price action completes an inside bar pattern, mark the low and high of the mother candle.
If the price goes upwards, then take a long position, if it goes below the closing price of the mother candle, go short.
Stop Loss
If you have gone long, keep a buffer of 1% at the low of the mother candle.
If you have gone short, keep a buffer of 1% at the high of the mother candle.
Profit Booking
If the stop loss is say 40 points away, make it a 2:3 trade, by putting a target of 120 points.
If you are conservative, you can go with a 1:2 trade, i.e., for 40 points of stop loss, you would look for a 80 point target.
Exit
Smart trade management strategy would be to keep trailing the stop loss, once the price has moved in your desired direction.
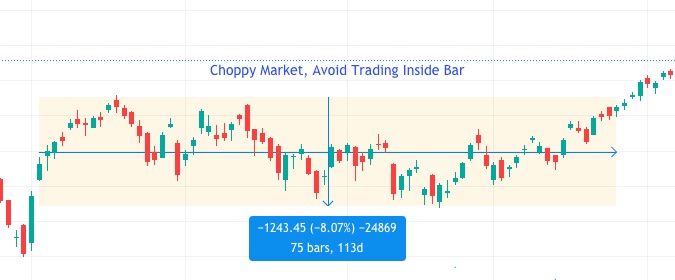
When Not to Trade the Inside Bar?
Avoid trading the inside bar, when the markets are choppy. The inside bar formations could be a trap.
What are some popular Inside Bar Candle Trading Strategy?
1. Fakey Trading Strategy
It is a false inside bar breakout strategy. A false breakout is a breakout that failed to continue beyond a certain level.
When the prie approaches the resistance, and it forms an Inside Bar, the traders usually would go short.
Or, if the price approaches the support, traders would like to go long on the formation of the inside bar.
In both the cases, chances of getting trapped is very high. Instead, there are two better approaches.
Wait for the trend to reverse, and then let the inside bar form again, in this case the probability of success of an inside bar is higher.
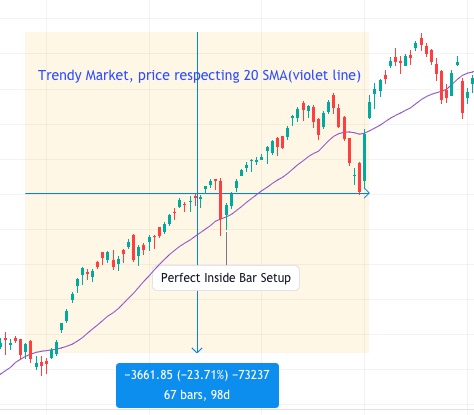
2. Insdie Bar with SMA
If the prie is above 20 SMA, and the SMA line has a positive gradient market is considered to be in an uptrend, if price is below 20 SMA, and the SMA has a negative gradient market is considered to be in a downtrend.
In trending market if the price pulls back to 20 SMA, wait for the inside bar formation, and then go long or short.
3. Volume Breakout
If the volume at the break out is greater than 10 SMA of volume, it becomes a very high probability inside bar trade.
Five Charecteristic of a Profitable Inside Bar Trade Setup
-
Higher Time Frame : An inside bar that forms on the higher time frame has more “weight” simply because the pattern took more time to form. This means more raders were actively involved in this formation, signifying more volume and capital.
-
Trending Market : There can arise small moments of indecision even in trending markets, these are good times to enter into a trade.
-
Relative Size : The smaller the child(ren) candle, the greater chances of expereincing a profitable setup.
-
Location of Inside Bar : It is good to avoid children bar that form near the middle of the body of mother candle, they do not signify any direction and are confusing. Conversely, if the child forms towards the upper range, the price is more likely to give a prositive breakout, and if the child forms towards the lower range, the price is more likely to give a negative break out.
-
SMA : It can act as a major support or resistance, if an inside bar formation happens near SMA, the probability of success is very high.
I hope the article was of help.
Make profits, Enjoy Life!