In this article we will discuss how to trade bullish engulfing patterns.
1. What is a Bullish Engulfing Pattern?
A bullish engulfing bar or bullish engulfing candle typically forms after an extended fall in the market. It signlas the point where the bears have started to book profits and bulls have started to show interest.
The following pointers will help you to identify a bullish engulfing pattern
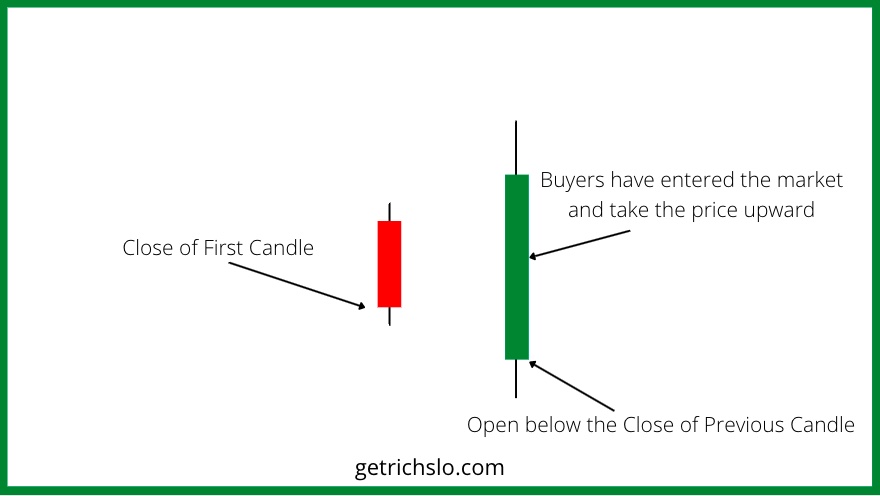
1. Previous candle is a red candle.
2. Current candle is green candle.
3. Open of current candle is lower than close of previous.
4. Close of current candle is greater than the open of previous candle.
5. Ideally, the low of current day is lower than previous day, and high of current day is higher than previous day.
The longer the body of the green candle, the stronger the buy signal.
2. Bullish Engulfing Example
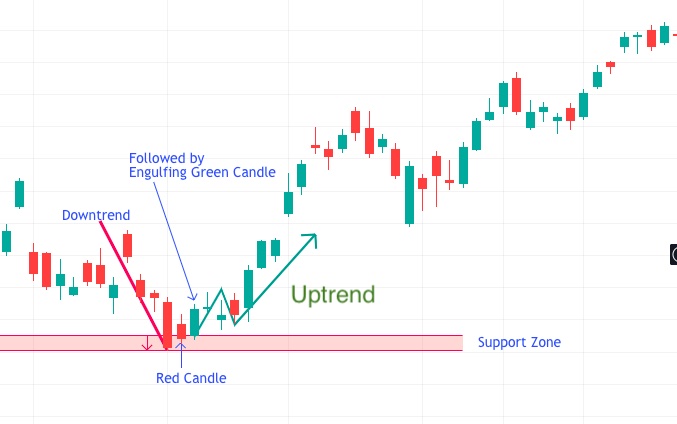
Here is a live market example chart of the formation of a bullish engulfing pattern.
The market is initally in a downtrend and may take support at the support zone.
Suddenly a green candle forms that engulfs the red candle.
The downtrend is reversed and the rally starts after making the price-action.
3. Bullish Engulfing Pattern Reliability
According to technical analsts it can predict an upcoming trend after a period of bearish sentiment. The bullish engulfing pattern consists of a short red candle followed by a green candle, that completely engulfs the previous candle.
A bullish engulfing pattern signifies an end to the bear fall. It is an indication for short sellers to exit their trade and invitation to the bulls to enter the market.
4. How does the bullish engulfing pattern form?
Bottom Candle : A small red candle at the end of a downtrend.
Reversal Candle : The market opens gap down and opens lower than the price of Day 1, but during the day, the bears start booking profit and bulls enter with long position.
Analysts pay special attention to the bullish engulfing pattern since it signifies a trend reversal. If volume increases along with the price, it presents a great buy on dip opportunity.
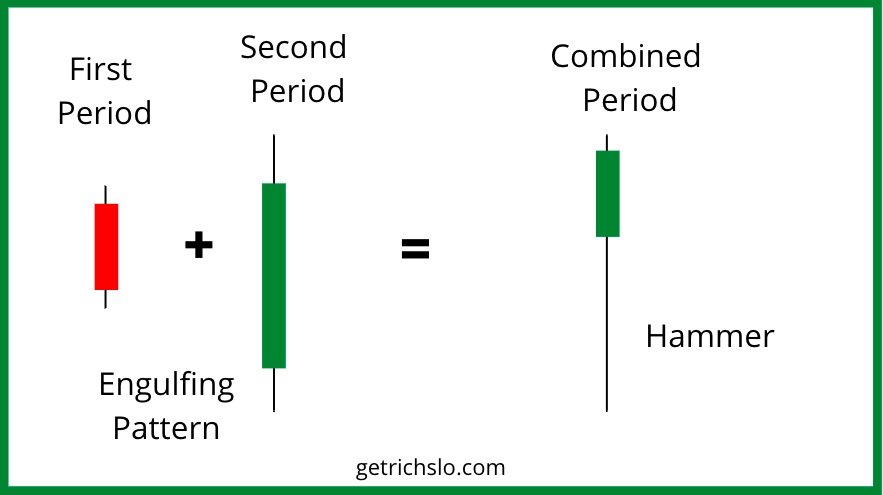
5. Bullish Engulfing and Hammer
A bullish engulfing is essentially a hammer on the longer time-frame. For instance a bearish candle on a one hour time frame followed by a bullish candle that engulfs the previous one, will appear a hammer on the two hour time-frame.
6. How to Trade Bullish Engulfing Pattern?
A bullisg engulfing pattern does not occur that frequently, but when they do it’s important that you know how to take full advantage of them.
The typical strategy is to enter into the trade only after trend confirmation. If the next candlestick continues the sentiment set by the previous pattern, it is good to enter the trade, else it might signify a false breakout.
Here is a simple guide on trading the engulfing pattern.
Market Trend
The initial market trend should ideally be bearish.
Zone
The red candle should be formed near the support.
Entry
Enter only after the confirmation of the candle after then enfulfing candle. This means:
Candle 1 : a red candle formed near support.
Candle 2 : a bullish candle forms that engulfs the red candle.
Candle 3 : the bullish momentum continues, with volume.
Enter the trade on the 4 th candle.
Stop Loss
Place the stop loss at the bottom of the first red candle.
Target
Take the target to be 3 times the stop loss or twice that of the stop loss. For instance, if the bottom of the first red candle is 1000, and market is currently at 1200, the stop loss is 200 points, hence the target could be 400 points to 600 points.
I hope the article was of help.
Make profits, Enjoy Life!